
You enter your site URL into PageSpeed Insights and the mobile performance score comes back red. A long list of unfamiliar diagnostics follows, covering images, JavaScript, caching, and more. It can feel as though everything needs fixing, but simply asking the development team to “raise the score” makes the scope of work difficult to define.
The first distinction to make is between a low score and a problem real users experience. Alongside the score, I record the page, device, and action where the problem occurs. A product that appears late on the first screen and a purchase button that does not respond require different work.
1. Read field data and lab results separately
PageSpeed Insights brings together data of different kinds. Its field data consists of observations from the Chrome User Experience Report, or CrUX. Its lab results are diagnostics from Lighthouse running the page under particular conditions. A single lab score does not represent the speed experienced by every visitor. See the official PageSpeed Insights explanation for the scope of each data source.
When examining field data, first check whether it covers “This URL” or the “Origin.” If there are too few samples for the URL, the report may show data covering multiple pages on the same origin. Reporting that as the result for one product page would misstate its scope. Field data may be unavailable if neither has enough samples; an absence of data is not a verdict that the site is fast.
CrUX reflects observations from the last 28 days, so a fix deployed today does not immediately represent the whole period. Lab results can help you quickly examine the effects of today's code changes, while field data can help you follow whether those changes also improve user experience. Do not compare the two as though they were identical measurements from the same day.
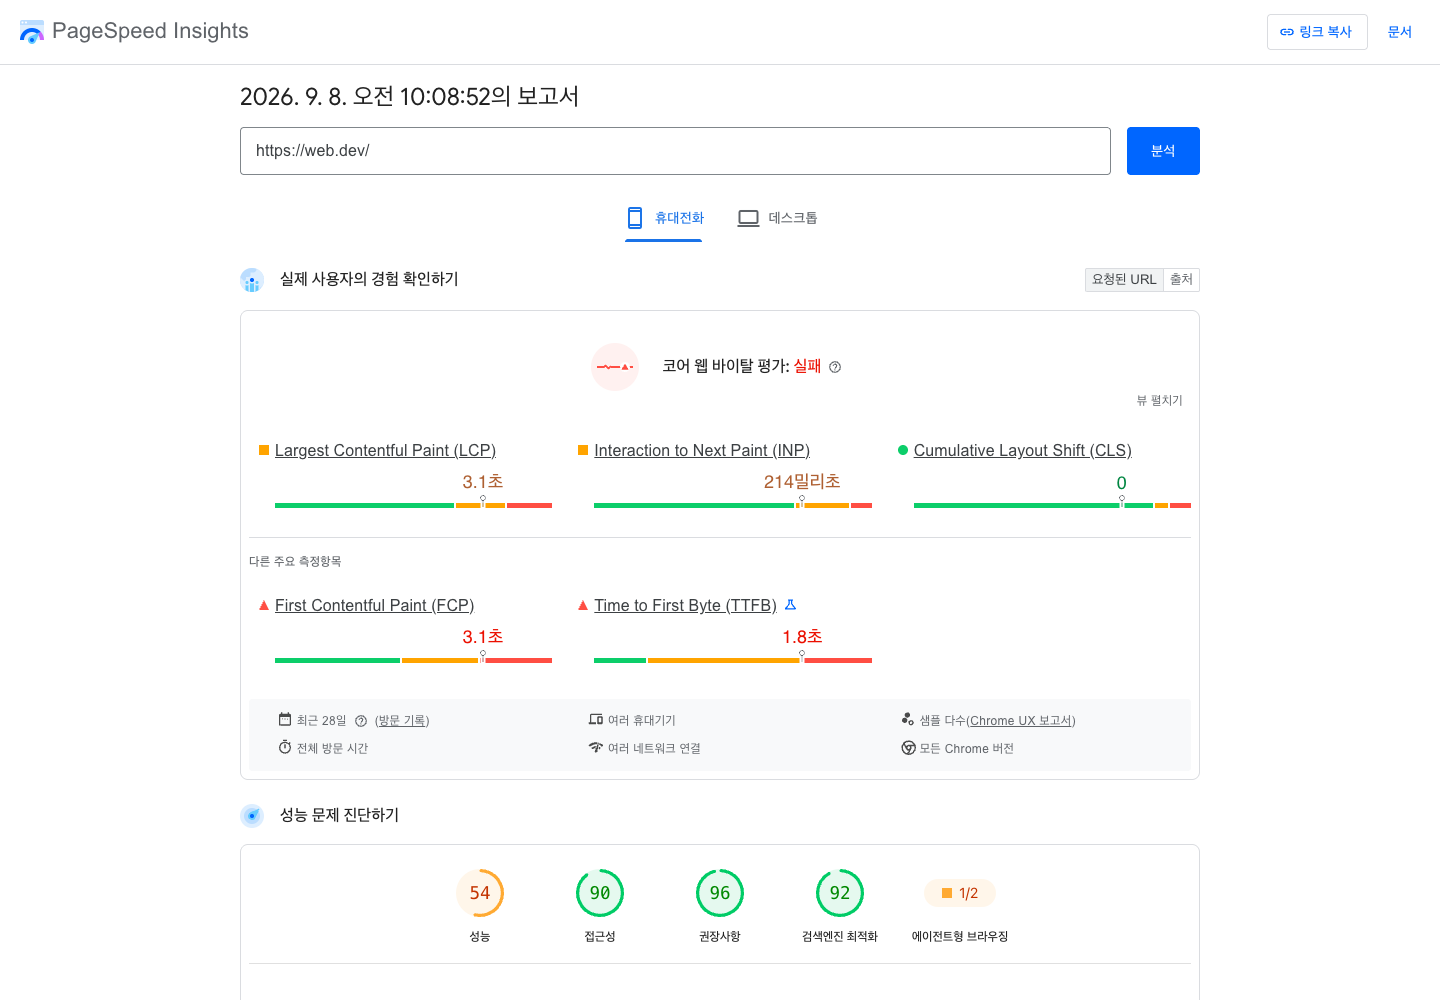
2. Connect LCP, INP, and CLS to the problems users experience
It is easier to decide what to do next when you connect each acronym to a user problem instead of simply memorizing it. The table below shows the three metrics and thresholds for a good experience from web.dev's Core Web Vitals guide. Assess the 75th percentile of real user experiences, separately for mobile and desktop. This is not the result for a single average visitor.
| Metric | What it measures | Good threshold | Situation to check |
|---|---|---|---|
| LCP | When the largest visible image or text block is rendered | 2.5 seconds or less | The main product image or text appears late |
| INP | Responsiveness from a click, tap, or keyboard input to the next visual update | 200 milliseconds or less | The selected state appears late after tapping an option |
| CLS | Unexpected changes in the position of page elements | 0.1 or less | The button a user was about to tap moves elsewhere |
INP does not mean the entire server processing time needed to complete an order. A button may immediately show that processing has started even though payment takes longer to complete. Conversely, a simple action may respond slowly because the browser is busy with other work. Specify which moment feels slow when reporting the problem.
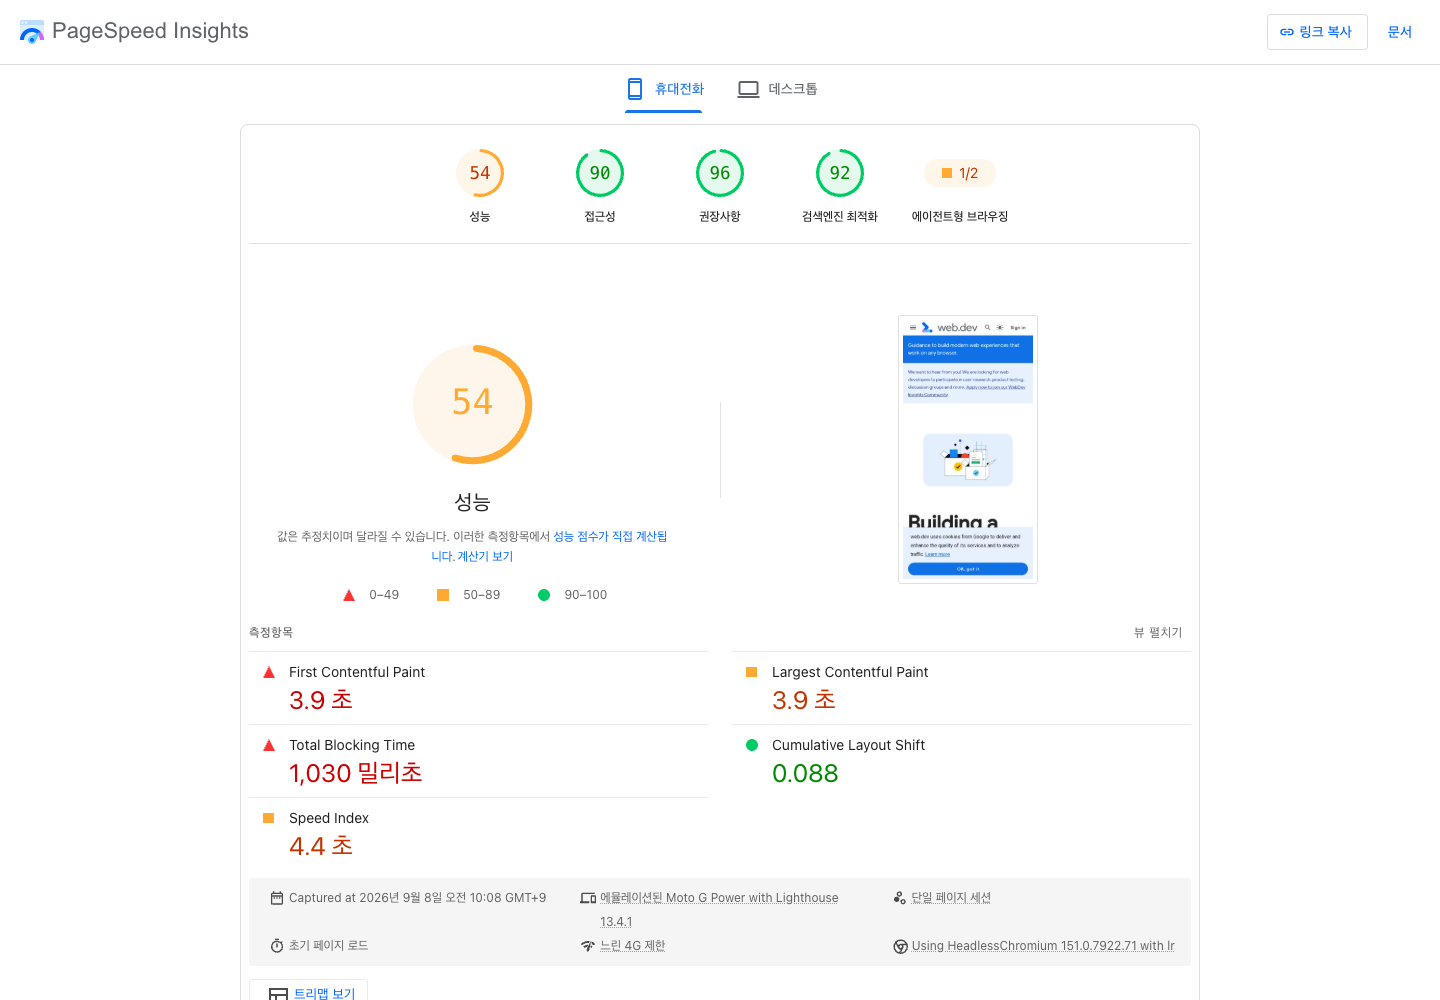
The TBT shown in lab results is also a different metric from INP. As the guide to Core Web Vitals tools explains, it can help identify long tasks during loading, but it does not stand in for measuring a user opening a filter and typing later. Improvement starts with distinguishing what each metric actually observes.
3. When LCP is slow, look beyond the size of the large image
A large image appearing late on the first screen does not mean every image needs more compression. The cause differs depending on whether the browser discovers the image late, takes a long time to download it, or cannot display it after downloading. If receiving the initial HTML is slow, replacing the image alone may not resolve the issue.
A site manager can first work with the development team to identify which element is being measured as LCP. If it is the main image, check whether the file is far larger than its displayed dimensions require, whether several banners load at once, or whether the first-screen image is set to lazy-load. Images farther down the page do not need the same loading priority as the key image on the first screen.
The Chrome team's LCP optimization guide explains how to separate delays in resource discovery, downloading, and rendering. A request such as “Check when the main image on the mobile first screen is requested and displayed” is therefore more specific than “Optimize images.” After changing the format or compression, also check the image yourself to ensure that quality and product identification have not suffered.
4. When buttons respond slowly, examine the work happening at that moment
Try frequently used features on a phone: menus, product options, search filters, and add-to-cart buttons. Record whether they are slow only on first opening, when the number of items increases, or in one particular feature. “The selected state appears late when I change the color after opening the option list” helps identify the cause more than “Mobile is slow.”
Third-party chat, advertising, and analytics scripts are also worth examining. However, removing them directly from the live site because they look unnecessary could also stop measurement or customer support. Identify who owns each function and compare its execution timing and workload in a test environment.
The INP optimization guide explains how to identify slow interactions and analyze input delay, processing time, and presentation delay. A site manager does not need to diagnose every internal cause. Provide the steps to reproduce the issue and a recording of the slow moment. Once developers identify the cause, verify together that filtering, purchasing, and measurement still work.
5. When the layout shifts, look for elements arriving late
If an ad pushes the text down while someone is reading, or a banner expands just as they try to tap a product button, the person has to find their place again. These problems can remain even when downloads are fast. Check whether space is reserved for images and ads, and whether a font change substantially alters the number of text lines.
For example, if the price and button move down when a product photo appears, check whether the space maintains the required aspect ratio before the photo loads. Examine cookie notices, promotional banners, and embedded videos in the same way. The task is to keep neighboring elements from moving unexpectedly when the photo arrives, rather than simply remove the photo.
The CLS optimization guide identifies images without dimensions, ads, embeds, and fonts among common causes. Even if a basic load diagnostic finds no issue, shifts may occur while someone reads and scrolls. Complete the actual task on the page instead of checking only the first screen.
6. Prioritize fixes by their impact, not just the score
Measuring only the home page can miss problems in articles reached through search, ad landing pages, and product detail pages. Start with pages that receive substantial traffic and pages important to inquiries or purchases. Include representative URLs for pages that share a structure. If a common template causes problems across many pages, one fix may have a broad effect.
The following is an example of prioritization, not a measurement result. If you find both a decorative effect on a low-traffic company page and a delay preventing option selection on an important product page, you could investigate the latter first. Recording the reach of the problem, severity of the inconvenience, cost of the fix, and risk of breaking functionality gives you a basis for scheduling development work.
According to the Lighthouse scoring explanation, the overall performance score is calculated by weighting measured metrics and can vary with run conditions. Reducing the number of diagnostic findings does not necessarily raise the score by a corresponding amount. Do not report only the single run with the highest score; check whether several runs under the same conditions show a similar improvement.
7. Give developers a reproducible request, not just a score
Include the URL, mobile or desktop setting, measurement date and report link, scope of field data, problematic metric, and steps to reproduce the issue. For example: “On the mobile product page, changing the color after opening the option list responds slowly. Check the processing for this interaction and the effect of third-party scripts, then compare again under the same conditions after the fix.” Do not name a particular script as the culprit before the cause has been confirmed.
Immediately after a fix, rerun lab measurements and test functionality, then continue observing changes in field metrics. Check that the purchase button works, analytics events are collected, and images and videos display correctly. If an important function disappeared in pursuit of a score, it is difficult to call the improvement complete.
Google recommends a good user experience in its guidance on Core Web Vitals and Search. Its separate page experience guidance explains that good metrics alone do not guarantee a top position in search. Do not treat a PageSpeed score of 100 as a guarantee of rankings or revenue. Instead of defining the goal solely as “100 points,” ask: “Can users see important content without waiting? Do the buttons they need respond? Does the page stay stable while they read or tap?” As you measure and verify those answers, what to fix next becomes much clearer.